Background
In May I attended a great workshop on advances and challenges in machine learning languages at the CMS in Cambridge. There was an a good mix of people from different disciplines, and a bit of a theme around probabilistic programming. The workshop schedule includes links to many of the presentations, and is generally worth browsing. In particular, it includes a link to the slides for my presentation on a compositional approach to scalable Bayesian computation and probabilistic programming. I’ve given a few talks on this kind of thing over the last couple of years, at Newcastle, at the Isaac Newton Institute in Cambridge (twice), and at CIRM in France. But I think I explained things best at this workshop at the CMS, though my impression could partly have been a reflection of the more interested and relevant audience. In the talk I started with a basic explanation of why ideas from category theory and functional programming can help to solve problems in statistical computing in a more composable and scalable way, before moving on to discuss probability monads and their fundamental connection to probabilistic programming. The take home message from the talk is that if you have a generic inference algorithm, expressing the logic in the context of probability monads can give you an embedded probabilistic programming language (PPL) for that inference algorithm essentially “for free”.
So, during my talk I said something a little fool-hardy. I can’t remember my exact words, but while presenting the idea behind an SMC-based probability monad I said something along the lines of “one day I will write a blog post on how to write a probabilistic programming language from scratch in 50 lines of code, and this is how I’ll do it“! Rather predictably (with hindsight), immediately after my talk about half a dozen people all pleaded with me to urgently write the post! I’ve been a little busy since then, but now that things have settled down a little for the summer, I’ve some time to think and code, so here is that post.
Introduction
The idea behind this post is to show that, if you think about the problem in the right way, and use a programming language with syntactic support for monadic composition, then producing a flexible, general, compositional, embedded domain specific language (DSL) for probabilistic programming based on a given generic inference algorithm is no more effort than hard-coding two or three illustrative examples. You would need to code up two or three examples for a paper anyway, but providing a PPL is way more useful. There is also an interesting converse to this, which is that if you can’t easily produce a PPL for your “general” inference algorithm, then perhaps it isn’t quite as “general” as you thought. I’ll try to resist exploring that here…
To illustrate these principles I want to develop a fairly minimal PPL, so that the complexities of the inference algorithm don’t hide the simplicity of the PPL embedding. Importance sampling with resampling is probably the simplest useful generic Bayesian inference algorithm to implement, so that’s what I’ll use. Note that there are many limitations of the approach that I will adopt, which will make it completely unsuitable for “real” problems. In particular, this implementation is: inefficient, in terms of both compute time and memory usage, statistically inefficient for deep nesting and repeated conditioning, due to the particle degeneracy problem, specific to a particular probability monad, strictly evaluated, impure (due to mutation of global random number state), etc. All of these things are easily fixed, but all at the expense of greater abstraction, complexity and lines of code. I’ll probably discuss some of these generalisations and improvements in future posts, but for this post I want to keep everything as short and simple as practical. It’s also worth mentioning that there is nothing particularly original here. Many people have written about monadic embedded PPLs, and several have used an SMC-based monad for illustration. I’ll give some pointers to useful further reading at the end.
The language, in 50 lines of code
Without further ado, let’s just write the PPL. I’m using plain Scala, with just a dependency on the Breeze scientific library, which I’m going to use for simulating random numbers from standard distributions, and evaluation of their log densities. I have a directory of materials associated with this post in a git repo. This post is derived from an executable tut document (so you know it works), which can be found here. If you just want to follow along copying code at the command prompt, just run sbt from an empty or temp directory, and copy the following to spin up a Scala console with the Breeze dependency:
set libraryDependencies += "org.scalanlp" %% "breeze" % "1.0-RC4"
set libraryDependencies += "org.scalanlp" %% "breeze-natives" % "1.0-RC4"
set scalaVersion := "2.13.0"
console
We start with a couple of Breeze imports
import breeze.stats.{distributions => bdist}
import breeze.linalg.DenseVector
which are not strictly necessary, but clean up the subsequent code. We are going to use a set of weighted particles to represent a probability distribution empirically, so we’ll start by defining an appropriate ADT for these:
implicit val numParticles = 300

case class Particle[T](v: T, lw: Double) { // value and log-weight
  def map[S](f: T => S): Particle[S] = Particle(f(v), lw)
}
We also include a map method for pushing a particle through a transformation, and a default number of particles for sampling and resampling. 300 particles are enough for illustrative purposes. Ideally it would be good to increase this for more realistic experiments. We can use this particle type to build our main probability monad as follows.
trait Prob[T] {
  val particles: Vector[Particle[T]]
  def map[S](f: T => S): Prob[S] = Empirical(particles map (_ map f))
  def flatMap[S](f: T => Prob[S]): Prob[S] = {
    Empirical((particles map (p => {
      f(p.v).particles.map(psi => Particle(psi.v, p.lw + psi.lw))
    })).flatten).resample
  }
  def resample(implicit N: Int): Prob[T] = {
    val lw = particles map (_.lw)
    val mx = lw reduce (math.max(_,_))
    val rw = lw map (lwi => math.exp(lwi - mx))
    val law = mx + math.log(rw.sum/(rw.length))
    val ind = bdist.Multinomial(DenseVector(rw.toArray)).sample(N)
    val newParticles = ind map (i => particles(i))
    Empirical(newParticles.toVector map (pi => Particle(pi.v, law)))
  }
  def cond(ll: T => Double): Prob[T] =
    Empirical(particles map (p => Particle(p.v, p.lw + ll(p.v))))
  def empirical: Vector[T] = resample.particles.map(_.v)
}

case class Empirical[T](particles: Vector[Particle[T]]) extends Prob[T]
Note that if you are pasting into the Scala REPL you will need to use :paste mode for this. So Prob[_] is our base probability monad trait, and Empirical[_] is our simplest implementation, which is just a collection of weighted particles. The method flatMap forms the naive product of empirical measures and then resamples in order to stop an explosion in the number of particles. There are two things worth noting about the resample method. The first is that the log-sum-exp trick is being used to avoid overflow and underflow when the log weights are exponentiated. The second is that although the method returns an equally weighted set of particles, the log weights are all set in order that the average raw weight of the output set matches the average raw weight of the input set. This is a little tricky to explain, but it turns out to be necessary in order to correctly propagate conditioning information back through multiple monadic binds (flatMaps). The cond method allows conditioning of a distribution using an arbitrary log-likelihood. It is included for comparison with some other implementations I will refer to later, but we won’t actually be using it, so we could save two lines of code here if necessary. The empirical method just extracts an unweighted set of values from a distribution for subsequent analysis.
It will be handy to have a function to turn a bunch of unweighted particles into a set of particles with equal weights (a sort-of inverse of the empirical method just described), so we can define that as follows.
def unweighted[T](ts: Vector[T], lw: Double = 0.0): Prob[T] =
  Empirical(ts map (Particle(_, lw)))
Probabilistic programming is essentially trivial if we only care about forward sampling. But interesting PPLs allow us to condition on observed values of random variables. In the context of SMC, this is simplest when the distribution being conditioned has a tractable log-likelihood. So we can now define an extension of our probability monad for distributions with a tractable log-likelihood, and define a bunch of convenient conditioning (or “fitting”) methods using it.
trait Dist[T] extends Prob[T] {
  def ll(obs: T): Double
  def ll(obs: Seq[T]): Double = obs map (ll) reduce (_+_)
  def fit(obs: Seq[T]): Prob[T] =
    Empirical(particles map (p => Particle(p.v, p.lw + ll(obs))))
  def fitQ(obs: Seq[T]): Prob[T] = Empirical(Vector(Particle(obs.head, ll(obs))))
  def fit(obs: T): Prob[T] = fit(List(obs))
  def fitQ(obs: T): Prob[T] = fitQ(List(obs))
}
The only unimplemented method is ll(). The fit method re-weights a particle set according to the observed log-likelihood. For convenience, it also returns a particle cloud representing the posterior-predictive distribution of an iid value from the same distribution. This is handy, but comes at the expense of introducing an additional particle cloud. So, if you aren’t interested in the posterior predictive, you can avoid this cost by using the fitQ method (for “fit quick”), which doesn’t return anything useful. We’ll see examples of this in practice, shortly. Note that the fitQ methods aren’t strictly required for our “minimal” PPL, so we can save a couple of lines by omitting them if necessary. Similarly for the variants which allow conditioning on a collection of iid observations from the same distribution.
At this point we are essentially done. But for convenience, we can define a few standard distributions to help get new users of our PPL started. Of course, since the PPL is embedded, it is trivial to add our own additional distributions later.
case class Normal(mu: Double, v: Double)(implicit N: Int) extends Dist[Double] {
  lazy val particles = unweighted(bdist.Gaussian(mu, math.sqrt(v)).sample(N).toVector).particles
  def ll(obs: Double) = bdist.Gaussian(mu, math.sqrt(v)).logPdf(obs) }

case class Gamma(a: Double, b: Double)(implicit N: Int) extends Dist[Double] {
  lazy val particles = unweighted(bdist.Gamma(a, 1.0/b).sample(N).toVector).particles
  def ll(obs: Double) = bdist.Gamma(a, 1.0/b).logPdf(obs) }

case class Poisson(mu: Double)(implicit N: Int) extends Dist[Int] {
  lazy val particles = unweighted(bdist.Poisson(mu).sample(N).toVector).particles
  def ll(obs: Int) = bdist.Poisson(mu).logProbabilityOf(obs) }
Note that I’ve parameterised the Normal and Gamma the way that statisticians usually do, and not the way they are usually parameterised in scientific computing libraries (such as Breeze).
That’s it! This is a complete, general-purpose, composable, monadic PPL, in 50 (actually, 48, and fewer still if you discount trailing braces) lines of code. Let’s now see how it works in practice.
Examples
Normal random sample
We’ll start off with just about the simplest slightly interesting example I can think of: Bayesian inference for the mean and variance of a normal distribution from a random sample.
import breeze.stats.{meanAndVariance => meanVar}
// import breeze.stats.{meanAndVariance=>meanVar}

val mod = for {
  mu <- Normal(0, 100)
  tau <- Gamma(1, 0.1)
  _ <- Normal(mu, 1.0/tau).fitQ(List(8.0,9,7,7,8,10))
} yield (mu,tau)
// mod: Wrapped.Prob[(Double, Double)] = Empirical(Vector(Particle((8.718127116254472,0.93059589932682),-15.21683812389373), Particle((7.977706390420308,1.1575288208065433),-15.21683812389373), Particle((7.977706390420308,1.1744750937611985),-15.21683812389373), Particle((7.328100552769214,1.1181787982959164),-15.21683812389373), Particle((7.977706390420308,0.8283737237370494),-15.21683812389373), Particle((8.592847414557049,2.2934836446009026),-15.21683812389373), Particle((8.718127116254472,1.498741032928539),-15.21683812389373), Particle((8.592847414557049,0.2506065368748732),-15.21683812389373), Particle((8.543283880264225,1.127386759627675),-15.21683812389373), Particle((7.977706390420308,1.3508728798704925),-15.21683812389373), Particle((7.977706390420308,1.1134430556990933),-15.2168...

val modEmp = mod.empirical
// modEmp: Vector[(Double, Double)] = Vector((7.977706390420308,0.8748006833362748), (6.292345096890432,0.20108091703626174), (9.15330820843396,0.7654238730107492), (8.960935105658741,1.027712984079369), (7.455292602273359,0.49495749079351836), (6.911716909394562,0.7739749058662421), (6.911716909394562,0.6353785792877397), (7.977706390420308,1.1744750937611985), (7.977706390420308,1.1134430556990933), (8.718127116254472,1.166399872049532), (8.763777227034538,1.0468304705769353), (8.718127116254472,0.93059589932682), (7.328100552769214,1.6166695922250236), (8.543283880264225,0.4689300351248357), (8.543283880264225,2.0028918490755094), (7.536025958690963,0.6282318170458533), (7.328100552769214,1.6166695922250236), (7.049843463553113,0.20149378088848635), (7.536025958690963,2.3565657669819897...

meanVar(modEmp map (_._1)) // mu
// res0: breeze.stats.meanAndVariance.MeanAndVariance = MeanAndVariance(8.311171010932343,0.4617800639333532,300)

meanVar(modEmp map (_._2)) // tau
// res1: breeze.stats.meanAndVariance.MeanAndVariance = MeanAndVariance(0.940762723934599,0.23641881704888842,300)
Note the use of the empirical method to turn the distribution into an unweighted set of particles for Monte Carlo analysis. Anyway, the main point is that the syntactic sugar for monadic binds (flatMaps) provided by Scala’s for-expressions (similar to do-notation in Haskell) leads to readable code not so different to that in well-known general-purpose PPLs such as BUGS, JAGS, or Stan. There are some important differences, however. In particular, the embedded DSL has probabilistic programs as regular values in the host language. These may be manipulated and composed like other values. This makes this probabilistic programming language more composable than the aforementioned languages, which makes it much simpler to build large, complex probabilistic programs from simpler, well-tested, components, in a scalable way. That is, this PPL we have obtained “for free” is actually in many ways better than most well-known PPLs.
Noisy measurements of a count
Here we’ll look at the problem of inference for a discrete count given some noisy iid continuous measurements of it.
val mod = for {
  count <- Poisson(10)
  tau <- Gamma(1, 0.1)
  _ <- Normal(count, 1.0/tau).fitQ(List(4.2,5.1,4.6,3.3,4.7,5.3))
} yield (count, tau)
// mod: Wrapped.Prob[(Int, Double)] = Empirical(Vector(Particle((5,4.488795220669575),-11.591037521513753), Particle((5,1.7792314573063672),-11.591037521513753), Particle((5,2.5238021156137673),-11.591037521513753), Particle((4,3.280754333896923),-11.591037521513753), Particle((5,2.768438569482849),-11.591037521513753), Particle((4,1.3399975573518912),-11.591037521513753), Particle((5,1.1792835858615431),-11.591037521513753), Particle((5,1.989491156206883),-11.591037521513753), Particle((4,0.7825254987152054),-11.591037521513753), Particle((5,2.7113936834028793),-11.591037521513753), Particle((5,3.7615196800240387),-11.591037521513753), Particle((4,1.6833300961124709),-11.591037521513753), Particle((5,2.749183220798113),-11.591037521513753), Particle((5,2.1074062883430202),-11.591037521513...

val modEmp = mod.empirical
// modEmp: Vector[(Int, Double)] = Vector((4,3.243786594839479), (4,1.5090869158886693), (4,1.280656912383482), (5,2.0616356908358195), (5,3.475433097869503), (5,1.887582611202514), (5,2.8268877720514745), (5,0.9193261688050818), (4,1.7063629502805908), (5,2.116414832864841), (5,3.775508828984636), (5,2.6774941123762814), (5,2.937859946593459), (5,1.2047689975166402), (5,2.5658806161572656), (5,1.925890364268593), (4,1.0194093176888832), (5,1.883288825936725), (5,4.9503779454422965), (5,0.9045613180858916), (4,1.5795027943928661), (5,1.925890364268593), (5,2.198539449287062), (5,1.791363956348445), (5,0.9853760689818026), (4,1.6541388923071607), (5,2.599899960899971), (4,1.8904423810277957), (5,3.8983183765907836), (5,1.9242319515895554), (5,2.8268877720514745), (4,1.772120802027519), (5,2...

meanVar(modEmp map (_._1.toDouble)) // count
// res2: breeze.stats.meanAndVariance.MeanAndVariance = MeanAndVariance(4.670000000000004,0.23521739130434777,300)

meanVar(modEmp map (_._2)) // tau
// res3: breeze.stats.meanAndVariance.MeanAndVariance = MeanAndVariance(1.9678279101913874,0.9603971613375548,300)
I’ve included this mainly as an example of inference for a discrete-valued parameter. There are people out there who will tell you that discrete parameters are bad/evil/impossible. This isn’t true – discrete parameters are cool!
Linear model
Because our PPL is embedded, we can take full advantage of the power of the host programming language to build our models. Let’s explore this in the context of Bayesian estimation of a linear model. We’ll start with some data.
val x = List(1.0,2,3,4,5,6)
// x: List[Double] = List(1.0, 2.0, 3.0, 4.0, 5.0, 6.0)

val y = List(3.0,2,4,5,5,6)
// y: List[Double] = List(3.0, 2.0, 4.0, 5.0, 5.0, 6.0)

val xy = x zip y
// xy: List[(Double, Double)] = List((1.0,3.0), (2.0,2.0), (3.0,4.0), (4.0,5.0), (5.0,5.0), (6.0,6.0))
Now, our (simple) linear regression model will be parameterised by an intercept, alpha, a slope, beta, and a residual variance, v. So, for convenience, let’s define an ADT representing a particular linear model.
case class Param(alpha: Double, beta: Double, v: Double)
// defined class Param
Now we can define a prior distribution over models as follows.
val prior = for {
  alpha <- Normal(0,10)
  beta <- Normal(0,4)
  v <- Gamma(1,0.1)
} yield Param(alpha, beta, v)
// prior: Wrapped.Prob[Param] = Empirical(Vector(Particle(Param(-2.392517550699654,-3.7516090283880095,1.724680963054379),0.0), Particle(Param(7.60982717067903,-1.4318199629361292,2.9436745225038545),0.0), Particle(Param(-1.0281832158124837,-0.2799562317845073,4.05125312048092),0.0), Particle(Param(-1.0509321093485073,-2.4733837587060448,0.5856868459456287),0.0), Particle(Param(7.678898742733517,0.15616204936412104,5.064540017623097),0.0), Particle(Param(-3.392028985658713,-0.694412176170572,7.452625596437611),0.0), Particle(Param(3.0310535934425324,-2.97938526497514,2.138446100857938),0.0), Particle(Param(3.016959696424399,1.3370878561954143,6.18957854813488),0.0), Particle(Param(2.6956505371497066,1.058845844793446,5.257973123790336),0.0), Particle(Param(1.496225540527873,-1.573936445746...
Since our language doesn’t include any direct syntactic support for fitting regression models, we can define our own function for conditioning a distribution over models on a data point, which we can then apply to our prior as a fold over the available data.
def addPoint(current: Prob[Param], obs: (Double, Double)): Prob[Param] = for {
    p <- current
    (x, y) = obs
    _ <- Normal(p.alpha + p.beta * x, p.v).fitQ(y)
  } yield p
// addPoint: (current: Wrapped.Prob[Param], obs: (Double, Double))Wrapped.Prob[Param]

val mod = xy.foldLeft(prior)(addPoint(_,_)).empirical
// mod: Vector[Param] = Vector(Param(1.4386051853067798,0.8900831186754122,4.185564696221981), Param(0.5530582357040271,1.1296886766045509,3.468527573093037), Param(0.6302560079049571,0.9396563485293532,3.7044543917875927), Param(3.68291303096638,0.4781372802435529,5.151665328789926), Param(3.016959696424399,0.4438016738989412,1.9988914122633519), Param(3.016959696424399,0.4438016738989412,1.9988914122633519), Param(0.6302560079049571,0.9396563485293532,3.7044543917875927), Param(0.6302560079049571,0.9396563485293532,3.7044543917875927), Param(3.68291303096638,0.4781372802435529,5.151665328789926), Param(3.016959696424399,0.4438016738989412,1.9988914122633519), Param(0.6302560079049571,0.9396563485293532,3.7044543917875927), Param(0.6302560079049571,0.9396563485293532,3.7044543917875927), ...

meanVar(mod map (_.alpha))
// res4: breeze.stats.meanAndVariance.MeanAndVariance = MeanAndVariance(1.5740812481283812,1.893684802867127,300)

meanVar(mod map (_.beta))
// res5: breeze.stats.meanAndVariance.MeanAndVariance = MeanAndVariance(0.7690238868623273,0.1054479268115053,300)

meanVar(mod map (_.v))
// res6: breeze.stats.meanAndVariance.MeanAndVariance = MeanAndVariance(3.5240853748668695,2.793386340338213,300)
We could easily add syntactic support to our language to enable the fitting of regression-style models, as is done in Rainier, of which more later.
Dynamic generalised linear model
The previous examples have been fairly simple, so let’s finish with something a bit less trivial. Our language is quite flexible enough to allow the analysis of a dynamic generalised linear model (DGLM). Here we’ll fit a Poisson DGLM with a log-link and a simple Brownian state evolution. More complex models are more-or-less similarly straightforward. The model is parameterised by an initial state, state0, and and evolution variance, w.
val data = List(2,1,0,2,3,4,5,4,3,2,1)
// data: List[Int] = List(2, 1, 0, 2, 3, 4, 5, 4, 3, 2, 1)

val prior = for {
  w <- Gamma(1, 1)
  state0 <- Normal(0.0, 2.0)
} yield (w, List(state0))
// prior: Wrapped.Prob[(Double, List[Double])] = Empirical(Vector(Particle((0.12864918092587044,List(-2.862479260552014)),0.0), Particle((1.1706344622093179,List(1.6138397233532091)),0.0), Particle((0.757288087950638,List(-0.3683499919402798)),0.0), Particle((2.755201217523856,List(-0.6527488751780317)),0.0), Particle((0.7535085397802043,List(0.5135562407906502)),0.0), Particle((1.1630726564525629,List(0.9703146201262348)),0.0), Particle((1.0080345715326213,List(-0.375686732266234)),0.0), Particle((4.603723117526974,List(-1.6977366375222938)),0.0), Particle((0.2870669117815037,List(2.2732160435099433)),0.0), Particle((2.454675218313211,List(-0.4148287542786906)),0.0), Particle((0.3612534201761152,List(-1.0099270904161748)),0.0), Particle((0.29578453393473114,List(-2.4938128878051966)),0.0)...
We can define a function to create a new hidden state, prepend it to the list of hidden states, and condition on the observed value at that time point as follows.
def addTimePoint(current: Prob[(Double, List[Double])],
  obs: Int): Prob[(Double, List[Double])] = for {
  tup <- current
  (w, states) = tup
  os = states.head
  ns <- Normal(os, w)
  _ <- Poisson(math.exp(ns)).fitQ(obs)
} yield (w, ns :: states)
// addTimePoint: (current: Wrapped.Prob[(Double, List[Double])], obs: Int)Wrapped.Prob[(Double, List[Double])]
We then run our (augmented state) particle filter as a fold over the time series.
val mod = data.foldLeft(prior)(addTimePoint(_,_)).empirical
// mod: Vector[(Double, List[Double])] = Vector((0.053073252551193446,List(0.8693030057529023, 1.2746526177834938, 1.020307245610461, 1.106341696651584, 1.070777529635013, 0.8749041525303247, 0.9866999164354662, 0.4082577920509255, 0.06903234462140699, -0.018835642776197814, -0.16841912034400547, -0.08919045681401294)), (0.0988871875952762,List(-0.24241948109998607, 0.09321618969352086, 0.9650532206325375, 1.1738734442767293, 1.2272325310228442, 0.9791695328246326, 0.5576319082578128, -0.0054280215024367084, 0.4256621012454391, 0.7486862644576158, 0.8193517409118243, 0.5928750312493785)), (0.16128799384962295,List(-0.30371187329667104, -0.3976854602292066, 0.5869357473774455, 0.9881090696832543, 1.2095181380307558, 0.7211231597865506, 0.8085486452269925, 0.2664373341459165, -0.627344024142...

meanVar(mod map (_._1)) // w
// res7: breeze.stats.meanAndVariance.MeanAndVariance = MeanAndVariance(0.29497487517435844,0.0831412016262515,300)

meanVar(mod map (_._2.reverse.head)) // state0 (initial state)
// res8: breeze.stats.meanAndVariance.MeanAndVariance = MeanAndVariance(0.04617218427664018,0.372844704533101,300)

meanVar(mod map (_._2.head)) // stateN (final state)
// res9: breeze.stats.meanAndVariance.MeanAndVariance = MeanAndVariance(0.4937178761565612,0.2889287607470016,300)
Summary, conclusions, and further reading
So, we’ve seen how we can build a fully functional, general-purpose, compositional, monadic PPL from scratch in 50 lines of code, and we’ve seen how we can use it to solve real, analytically intractable Bayesian inference problems of non-trivial complexity. Of course, there are many limitations to using exactly this PPL implementation in practice. The algorithm becomes intolerably slow for deeply nested models, and uses unreasonably large amounts of RAM for large numbers of particles. It also suffers from a particle degeneracy problem if there are too many conditioning events. But it is important to understand that these are all deficiencies of the naive inference algorithm used, not the PPL itself. The PPL is flexible and compositional and can be used to build models of arbitrary size and complexity – it just needs to be underpinned by a better, more efficient, inference algorithm. Rainier is a Scala library I’ve blogged about previously which uses a very similar PPL to the one described here, but is instead underpinned by a fast, efficient, HMC algorithm. With my student Jonny Law, we have recently arXived a paper on Functional probabilistic programming for scalable Bayesian modelling, discussing some of these issues, and exploring the compositional nature of monadic PPLs (somewhat glossed over in this post).
Since the same PPL can be underpinned by different inference algorithms encapsulated as probability monads, an obvious question is whether it is possible to abstract the PPL away from the inference algorithm implementation. Of course, the answer is “yes”, and this has been explored to great effect in papers such as Practical probabilistic programming with monads and Functional programming for modular Bayesian inference. Note that they use the cond approach to conditioning, which looks a bit unwieldy, but is equivalent to fitting. As well as allowing alternative inference algorithms to be applied to the same probabilistic program, it also enables the composing of inference algorithms – for example, composing a MH algorithm with an SMC algorithm in order to get a PMMH algorithm. The ideas are implemented in an embedded DSL for Haskell, monad-bayes. If you are not used to Haskell, the syntax will probably seem a bit more intimidating than Scala’s, but the semantics are actually quite similar, with the main semantic difference being that Scala is strictly evaluated by default, whereas Haskell is lazily evaluated by default. Both languages support both lazy and strict evaluation – the difference relates simply to default behaviour, but is important nevertheless.
Papers
- Law and Wilkinson (2019) Functional probabilistic programming for scalable Bayesian modelling, arXiv
- Scibior et al (2015) Practical probabilistic programming with monads, Haskell ’15
- Scibior et al (2018) Functional programming for modular Bayesian inference, ICFP
Software
- min-ppl – code associated with this blog post
- Rainier – a more efficient PPL with similar syntax
- monad-bayes – a Haskell library exploring related ideas


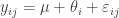
 represents how the ith University differs from the overall mean. We know that this model is not actually identifiable when the model parameters are all treated as “fixed effects”, but R will handle this for us.
 , latent variables
  and data
  , of the form
 . On the other hand, the PMMH algorithm is an MCMC algorithm which targets the full joint posterior distribution
  . Now, the PMMH scheme does reduce to the pseudo-marginal scheme if samples of
  ). Below I will describe the algorithm and explain why it works, but first it is necessary to understand the relationship between marginal, joint and “likelihood-free” MCMC updating schemes for such latent variable models.
 is proposed from
  and accepted with probability
  , where
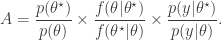
 required in the acceptance ratio is often difficult to compute.
 even when we can’t evaluate it, or marginalise
  is simulated from the model
  . The pair
  is then jointly accepted with ratio
 . The pair
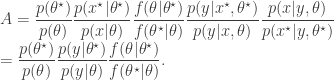
 , as the algorithms above. First, a proposed new
  is generated by running a bootstrap particle filter (as described in the previous post, and below) using the proposed new model parameters,
  is accepted using the Metropolis-Hastings ratio
 is the particle filter’s (unbiased) estimate of marginal likelihood, described in the previous post, and below. Note that this approach tends to the perfect joint/marginal updating scheme as the number of particles used in the filter tends to infinity. Note also that for a single particle, the particle filter just blindly forward simulates from
  and that the filter’s estimate of marginal likelihood is just the observed data likelihood
  leading precisely to the simple likelihood-free scheme. To understand for an arbitrary finite number of particles,
  , one needs to think carefully about the structure of the particle filter.
 ,
,  ,
,  . Initialise the particle filter with
  , where
  and
and  (note that
  is undefined). Now suppose at time
  we have a sample from
  :
:  . First resample by sampling
  ,
,  . Here we use
  for the discrete distribution on
  with probability mass function
  . Next sample
  . Set
. Set 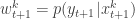 and
and 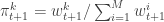 . Finally, propagate
  to the next step… We define the filter’s estimate of likelihood as
 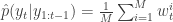 and
and 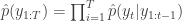 . See
. See ![\displaystyle \tilde{q}(\mathbf{x}_0,\ldots,\mathbf{x}_T,\mathbf{a}_0,\ldots,\mathbf{a}_{T-1}) = \left[\prod_{k=1}^M p(x_0^k)\right] \left[\prod_{t=0}^{T-1} \prod_{k=1}^M \pi_t^{a_t^k} p(x_{t+1}^k|x_t^{a_t^k}) \right]](https://s0.wp.com/latex.php?latex=%5Cdisplaystyle++%5Ctilde%7Bq%7D%28%5Cmathbf%7Bx%7D_0%2C%5Cldots%2C%5Cmathbf%7Bx%7D_T%2C%5Cmathbf%7Ba%7D_0%2C%5Cldots%2C%5Cmathbf%7Ba%7D_%7BT-1%7D%29++%3D+%5Cleft%5B%5Cprod_%7Bk%3D1%7D%5EM+p%28x_0%5Ek%29%5Cright%5D+%5Cleft%5B%5Cprod_%7Bt%3D0%7D%5E%7BT-1%7D++++%5Cprod_%7Bk%3D1%7D%5EM+%5Cpi_t%5E%7Ba_t%5Ek%7D+p%28x_%7Bt%2B1%7D%5Ek%7Cx_t%5E%7Ba_t%5Ek%7D%29+%5Cright%5D++&bg=ffffff&fg=333333&s=0&c=20201002)
 from
from  giving the joint density

 , and
, and  . If we now think about the structure of the PMMH algorithm, our proposal on the space of all random variables in the problem is in fact

 when we consider just the parameters and the selected trajectory. But if we consider the terms in the joint distribution of the proposal corresponding to the trajectory selected by
 ![\displaystyle p_\theta(x_0^{b_0^{k'}})\left[\prod_{t=0}^{T-1} \pi_t^{b_t^{k'}} p_\theta(x_{t+1}^{b_{t+1}^{k'}}|x_t^{b_t^{k'}})\right]\pi_T^{k'} = p_\theta(x_{0:T}^{k'})\prod_{t=0}^T \pi_t^{b_t^{k'}}](https://s0.wp.com/latex.php?latex=%5Cdisplaystyle++p_%5Ctheta%28x_0%5E%7Bb_0%5E%7Bk%27%7D%7D%29%5Cleft%5B%5Cprod_%7Bt%3D0%7D%5E%7BT-1%7D+%5Cpi_t%5E%7Bb_t%5E%7Bk%27%7D%7D++++p_%5Ctheta%28x_%7Bt%2B1%7D%5E%7Bb_%7Bt%2B1%7D%5E%7Bk%27%7D%7D%7Cx_t%5E%7Bb_t%5E%7Bk%27%7D%7D%29%5Cright%5D%5Cpi_T%5E%7Bk%27%7D++%3D++p_%5Ctheta%28x_%7B0%3AT%7D%5E%7Bk%27%7D%29%5Cprod_%7Bt%3D0%7D%5ET+%5Cpi_t%5E%7Bb_t%5E%7Bk%27%7D%7D++&bg=ffffff&fg=333333&s=0&c=20201002)
 in terms of the unnormalised weights, simplifies to
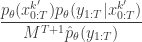
 in the acceptance ratio, we knock out the normalising constant, allowing all of the other terms in the proposal to be marginalised away. In other words, the target of the chain can be written as proportional to

