Part 3: The Metropolis algorithm
Introduction
This is the third part in a series of posts on MCMC-based Bayesian inference for a logistic regression model. If you are new to this series, please go back to Part 1.
In the previous post we derived the log posterior for the model and implemented it in a variety of programming languages and libraries. In this post we will construct a Markov chain having the posterior as its equilibrium.
MCMC
Detailed balance
A homogeneous Markov chain with transition kernel  is said to satisfy detailed balance for some target distribution
  if
if

Integrating both sides wrt  gives
gives
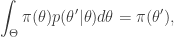
from which it is clear that  is a stationary distribution of the chain (and the chain is reversible). Under fairly mild regularity conditions we expect to be the equilibrium distribution of the chain.
For a given target we would like to find an easy-to-sample-from transition kernel  that satisfies detailed balance. This will then give us a way to (asymptotically) generate samples from our target.
In the context of Bayesian inference, the target will typically be the posterior distribution, which in the previous post we wrote as  . Here we drop the notational dependence on
  , since MCMC can be used for any target distribution of interest.
Metropolis-Hastings
Suppose we have a fairly arbitrary easy-to-sample-from transition kernel  and a target of interest, . Metropolis-Hastings (M-H) is a strategy for using
  to construct a new transition kernel satisfying detailed balance for .
The kernel  can be described algorithmically as follows:
- Call the current state of the chain . Generate a proposal
 by simulating from
  .
.
- Compute the acceptance probability
![\displaystyle \alpha(\theta^\star|\theta) = \min\left[1,\frac{\pi(\theta^\star)q(\theta|\theta^\star)}{\pi(\theta)q(\theta^\star|\theta)}\right].](https://s0.wp.com/latex.php?latex=%5Cdisplaystyle+%5Calpha%28%5Ctheta%5E%5Cstar%7C%5Ctheta%29+%3D+%5Cmin%5Cleft%5B1%2C%5Cfrac%7B%5Cpi%28%5Ctheta%5E%5Cstar%29q%28%5Ctheta%7C%5Ctheta%5E%5Cstar%29%7D%7B%5Cpi%28%5Ctheta%29q%28%5Ctheta%5E%5Cstar%7C%5Ctheta%29%7D%5Cright%5D.+&bg=ffffff&fg=333333&s=0&c=20201002)
- With probability
 return new state
  , otherwise return
  .
.
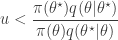
It is clear from the algorithmic description that this kernel will have a point mass at , but that for  the transition kernel will be
 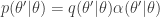 . But then
![\displaystyle \pi(\theta)p(\theta'|\theta) = \min[\pi(\theta)q(\theta'|\theta),\pi(\theta')q(\theta|\theta')]](https://s0.wp.com/latex.php?latex=%5Cdisplaystyle+%5Cpi%28%5Ctheta%29p%28%5Ctheta%27%7C%5Ctheta%29+%3D+%5Cmin%5B%5Cpi%28%5Ctheta%29q%28%5Ctheta%27%7C%5Ctheta%29%2C%5Cpi%28%5Ctheta%27%29q%28%5Ctheta%7C%5Ctheta%27%29%5D+&bg=ffffff&fg=333333&s=0&c=20201002)
is symmetric in and  , and so detailed balance is satisfied. Since detailed balance is trivial at the point mass at
  we are done.
Metropolis algorithm
It is often convenient to generate proposals perturbatively, using a distribution that is symmetric about the current state of the chain. But then  , and so drops out of the acceptance probability. This is the Metropolis algorithm.
Some computational tricks
To generate an event with probability , we can generate a  and accept if
  . This is convenient for several reasons. First, it means that we can ignore the "min", and just accept if
since  regardless. Better still, we can take logs, and accept if

so there is no need to evaluate any raw densities. Again, in the case of a symmetric proposal distribution, the terms can be dropped.
Another trick worth noting is that in the case of the simple M-H algorithm described, using a single update for the entire state space (and not multiple component-wise updates, for example), and assuming that the same M-H kernel is used repeatedly to generate successive states of a Markov chain, then the  term (which in the context of Bayesian inference will typically be the log posterior) will have been computed at the previous update (irrespective of whether or not the previous move was accepted). So if we are careful about how we pass on that old value to the next iteration, we can avoid recomputing the log posterior, and our algorithm will only require one log posterior evaluation per iteration rather than two. In functional programming languages it is often convenient to pass around this current log posterior density evaluation explicitly, effectively augmenting the state space of the Markov chain to include the log posterior density.
HoF for a M-H kernel
Since I’m a fan of functional programming, we will adopt a functional style throughout, and start by creating a higher-order function (HoF) that accepts a log-posterior and proposal kernel as input and returns a Metropolis kernel as output.
R
In R we can write a function to create a M-H kernel as follows.
mhKernel = function(logPost, rprop, dprop = function(new, old, ...) { 1 })
    function(x, ll) {
        prop = rprop(x)
        llprop = logPost(prop)
        a = llprop - ll + dprop(x, prop) - dprop(prop, x)
        if (log(runif(1)) < a)
            list(x=prop, ll=llprop)
        else
            list(x=x, ll=ll)
    }
Note that the kernel returned requires as input both a current state x and its associated log-posterior, ll. The new state and log-posterior densities are returned.
We need to use this transition kernel to simulate a Markov chain by successive substitution of newly simulated values back into the kernel. In more sophisticated programming languages we will use streams for this, but in R we can just use a for loop to sample values and write the states into the rows of a matrix.
mcmc = function(init, kernel, iters = 10000, thin = 10, verb = TRUE) {
p = length(init)
ll = -Inf
mat = matrix(0, nrow = iters, ncol = p)
colnames(mat) = names(init)
x = init
if (verb)
message(paste(iters, "iterations"))
for (i in 1:iters) {
if (verb)
message(paste(i, ""), appendLF = FALSE)
for (j in 1:thin) {
pair = kernel(x, ll)
x = pair$x
ll = pair$ll
}
mat[i, ] = x
}
if (verb)
message("Done.")
mat
}
Then, in the context of our running logistic regression example, and using the log-posterior from the previous post, we can construct our kernel and run it as follows.
pre = c(10.0,1,1,1,1,1,5,1)
out = mcmc(init, mhKernel(lpost,
function(x) x + pre*rnorm(p, 0, 0.02)), thin=1000)
Note the use of a symmetric proposal, so the proposal density is not required. Also note the use of a larger proposal variance for the intercept term and the second last covariate. See the full runnable script for further details.
Python
We can do something very similar to R in Python using NumPy. Our HoF for constructing a M-H kernel is
def mhKernel(lpost, rprop, dprop = lambda new, old: 1.):
    def kernel(x, ll):
        prop = rprop(x)
        lp = lpost(prop)
        a = lp - ll + dprop(x, prop) - dprop(prop, x)
        if (np.log(np.random.rand()) < a):
            x = prop
            ll = lp
        return x, ll
    return kernel
Our Markov chain runner function is
def mcmc(init, kernel, thin = 10, iters = 10000, verb = True):
    p = len(init)
    ll = -np.inf
    mat = np.zeros((iters, p))
    x = init
    if (verb):
        print(str(iters) + " iterations")
    for i in range(iters):
        if (verb):
            print(str(i), end=" ", flush=True)
        for j in range(thin):
            x, ll = kernel(x, ll)
        mat[i,:] = x
    if (verb):
        print("\nDone.", flush=True)
    return mat
We can use this code in the context of our logistic regression example as follows.
pre = np.array([10.,1.,1.,1.,1.,1.,5.,1.])

def rprop(beta):
    return beta + 0.02*pre*np.random.randn(p)

out = mcmc(init, mhKernel(lpost, rprop), thin=1000)
See the full runnable script for further details.
JAX
The above R and Python scripts are fine, but both languages are rather slow for this kind of workload. Fortunately it’s rather straightforward to convert the Python code to JAX to obtain quite amazing speed-up. We can write our M-H kernel as
def mhKernel(lpost, rprop, dprop = jit(lambda new, old: 1.)):
    @jit
    def kernel(key, x, ll):
        key0, key1 = jax.random.split(key)
        prop = rprop(key0, x)
        lp = lpost(prop)
        a = lp - ll + dprop(x, prop) - dprop(prop, x)
        accept = (jnp.log(jax.random.uniform(key1)) < a)
        return jnp.where(accept, prop, x), jnp.where(accept, lp, ll)
    return kernel
and our MCMC runner function as
def mcmc(init, kernel, thin = 10, iters = 10000):
    key = jax.random.PRNGKey(42)
    keys = jax.random.split(key, iters)
    @jit
    def step(s, k):
        [x, ll] = s
        x, ll = kernel(k, x, ll)
        s = [x, ll]
        return s, s
    @jit
    def iter(s, k):
        keys = jax.random.split(k, thin)
        _, states = jax.lax.scan(step, s, keys)
        final = [states[0][thin-1], states[1][thin-1]]
        return final, final
    ll = -np.inf
    x = init
    _, states = jax.lax.scan(iter, [x, ll], keys)
    return states[0]
There are really only two slightly tricky things about this code.
The first relates to the way JAX handles pseudo-random numbers. Since JAX is a pure functional eDSL, it can’t be used in conjunction with the typical pseudo-random number generators often used in imperative programming languages which rely on a global mutable state. This can be dealt with reasonably straightforwardly by explicitly passing around the random number state. There is a standard way of doing this that has been common practice in functional programming languages for decades. However, this standard approach is very sequential, and so doesn’t work so well in a parallel context. JAX therefore uses a splittable random number generator, where new states are created by splitting the current state into two (or more). We’ll come back to this when we get to the Haskell examples.
The second thing that might be unfamiliar to imperative programmers is the use of the scan operation (jax.lax.scan) to generate the Markov chain rather than a "for" loop. But scans are standard operations in most functional programming languages.
We can then call this code for our logistic regression example with
pre = jnp.array([10.,1.,1.,1.,1.,1.,5.,1.]).astype(jnp.float32)

@jit
def rprop(key, beta):
    return beta + 0.02*pre*jax.random.normal(key, [p])

out = mcmc(init, mhKernel(lpost, rprop), thin=1000)
See the full runnable script for further details.
Scala
In Scala we can use a similar approach to that already seen for defining a HoF to return a M-H kernel.
def mhKernel[S](
    logPost: S => Double, rprop: S => S,
    dprop: (S, S) => Double = (n: S, o: S) => 1.0
  ): ((S, Double)) => (S, Double) =
    val r = Uniform(0.0,1.0)
    state =>
      val (x0, ll0) = state
      val x = rprop(x0)
      val ll = logPost(x)
      val a = ll - ll0 + dprop(x0, x) - dprop(x, x0)
      if (math.log(r.draw()) < a)
        (x, ll)
      else
        (x0, ll0)
Note that Scala’s static typing does not prevent us from defining a function that is polymorphic in the type of the chain state, which we here call S. Also note that we are adopting a pragmatic approach to random number generation, exploiting the fact that Scala is not a pure functional language, using a mutable generator, and omitting to capture the non-determinism of the rprop function (and the returned kernel) in its type signature. In Scala this is a choice, and we could adopt a purer approach if preferred. We’ll see what such an approach will look like in Haskell, coming up next.
Now that we have the kernel, we don’t need to write an explicit runner function since Scala has good support for streaming data. There are many more-or-less sophisticated ways that we can work with data streams in Scala, and the choice depends partly on how pure one is being about tracking effects (such as non-determinism), but here I’ll just use the simple LazyList from the standard library for unfolding the kernel into an infinite MCMC chain before thinning and truncating appropriately.
  val pre = DenseVector(10.0,1.0,1.0,1.0,1.0,1.0,5.0,1.0)
  def rprop(beta: DVD): DVD = beta + pre *:* (DenseVector(Gaussian(0.0,0.02).sample(p).toArray))
  val kern = mhKernel(lpost, rprop)
  val s = LazyList.iterate((init, -Inf))(kern) map (_._1)
  val out = s.drop(150).thin(1000).take(10000)
See the full runnable script for further details.
Haskell
Since Haskell is a pure functional language, we need to have some convention regarding pseudo-random number generation. Haskell supports several styles. The most commonly adopted approach wraps a mutable generator up in a monad. The typical alternative is to use a pure functional generator and either explicitly thread the state through code or hide this in a monad similar to the standard approach. However, Haskell also supports the use of splittable generators, so we can consider all three approaches for comparative purposes. The approach taken does affect the code and the type signatures, and even the streaming data abstractions most appropriate for chain generation.
Starting with a HoF for producing a Metropolis kernel, an approach using the standard monadic generators could like like
mKernel :: (StatefulGen g m) => (s -> Double) -> (s -> g -> m s) ->
           g -> (s, Double) -> m (s, Double)
mKernel logPost rprop g (x0, ll0) = do
  x <- rprop x0 g
  let ll = logPost(x)
  let a = ll - ll0
  u <- (genContVar (uniformDistr 0.0 1.0)) g
  let next = if ((log u) < a)
        then (x, ll)
        else (x0, ll0)
  return next
Note how non-determinism is captured in the type signatures by the monad m. The explicit pure approach is to thread the generator through non-deterministic functions.
mKernelP :: (RandomGen g) => (s -> Double) -> (s -> g -> (s, g)) ->
            g -> (s, Double) -> ((s, Double), g)
mKernelP logPost rprop g (x0, ll0) = let
  (x, g1) = rprop x0 g
  ll = logPost(x)
  a = ll - ll0
  (u, g2) = uniformR (0, 1) g1
  next = if ((log u) < a)
        then (x, ll)
        else (x0, ll0)
  in (next, g2)
Here the updated random number generator state is returned from each non-deterministic function for passing on to subsequent non-deterministic functions. This explicit sequencing of operations makes it possible to wrap the generator state in a state monad giving code very similar to the stateful monadic generator approach, but as already discussed, the sequential nature of this approach makes it unattractive in parallel and concurrent settings.
Fortunately the standard Haskell pure generator is splittable, meaning that we can adopt a splitting approach similar to JAX if we prefer, since this is much more parallel-friendly.
mKernelP :: (RandomGen g) => (s -> Double) -> (s -> g -> s) ->
            g -> (s, Double) -> (s, Double)
mKernelP logPost rprop g (x0, ll0) = let
  (g1, g2) = split g
  x = rprop x0 g1
  ll = logPost(x)
  a = ll - ll0
  u = unif g2
  next = if ((log u) < a)
        then (x, ll)
        else (x0, ll0)
  in next
Here non-determinism is signalled by passing a generator state (often called a "key" in the context of splittable generators) into a function. Functions receiving a key are responsible for splitting it to ensure that no key is ever used more than once.
Once we have a kernel, we need to unfold our Markov chain. When using the monadic generator approach, it is most natural to unfold using a monadic stream
mcmc :: (StatefulGen g m) =>
  Int -> Int -> s -> (g -> s -> m s) -> g -> MS.Stream m s
mcmc it th x0 kern g = MS.iterateNM it (stepN th (kern g)) x0

stepN :: (Monad m) => Int -> (a -> m a) -> (a -> m a)
stepN n fa = if (n == 1)
  then fa
  else (\x -> (fa x) >>= (stepN (n-1) fa))
whereas for the explicit approaches it is more natural to unfold into a regular infinite data stream. So, for the explicit sequential approach we could use
mcmcP :: (RandomGen g) => s -> (g -> s -> (s, g)) -> g -> DS.Stream s
mcmcP x0 kern g = DS.unfold stepUf (x0, g)
  where
    stepUf xg = let
      (x1, g1) = kern (snd xg) (fst xg)
      in (x1, (x1, g1))
and with the splittable approach we could use
mcmcP :: (RandomGen g) =>
  s -> (g -> s -> s) -> g -> DS.Stream s
mcmcP x0 kern g = DS.unfold stepUf (x0, g)
  where
    stepUf xg = let
      (x1, g1) = xg
      x2 = kern g1 x1
      (g2, _) = split g1
      in (x2, (x2, g2))
Calling these functions for our logistic regression example is similar to what we have seen before, but again there are minor syntactic differences depending on the approach. For further details see the full runnable scripts for the monadic approach, the pure sequential approach, and the splittable approach.
Dex
Dex is a pure functional language and uses a splittable random number generator, so the style we use is similar to JAX (or Haskell using a splittable generator). We can generate a Metropolis kernel with
def mKernel {s} (lpost: s -> Float) (rprop: Key -> s -> s) :
    Key -> (s & Float) -> (s & Float) =
  def kern (k: Key) (sll: (s & Float)) : (s & Float) =
    (x0, ll0) = sll
    [k1, k2] = split_key k
    x = rprop k1 x0
    ll = lpost x
    a = ll - ll0
    u = rand k2
    select (log u < a) (x, ll) (x0, ll0)
  kern
We can then unfold our Markov chain with
def markov_chain {s} (k: Key) (init: s) (kern: Key -> s -> s) (its: Nat) :
    Fin its => s =
  with_state init \st.
    for i:(Fin its).
      x = kern (ixkey k i) (get st)
      st := x
      x
Here we combine Dex’s state effect with a for loop to unfold the stream. See the full runnable script for further details.
Next steps
As previously discussed, none of these codes are optimised, so care should be taken not to over-interpret running times. However, JAX and Dex are noticeably faster than the alternatives, even running on a single CPU core. Another interesting feature of both JAX and Dex is that they are differentiable. This makes it very easy to develop algorithms using gradient information. In subsequent posts we will think about the gradient of our example log-posterior and how we can use gradient information to develop "better" sampling algorithms.
The complete runnable scripts are all available from this public github repo.
 . We will see later why we want
  for our target of interest,
  as our position variable, rather than
  .
. when the particle is at position
 -dimensional, where
  , or
, or 
 is a diagonal matrix. But in fact, since we could change coordinates, there’s no reason to require that
  , which we define as
  . Then we can write our second order system as a pair of first order equations


![\displaystyle \dot{H} = \nabla V\cdot \dot{q} + \dot{p}^\text{T}M^{-1}p = \nabla V\cdot \dot{q} + \dot{p}^\text{T}\dot{q} = [\nabla V + \dot{p}]\cdot\dot{q} = 0.](https://s0.wp.com/latex.php?latex=%5Cdisplaystyle+%5Cdot%7BH%7D+%3D+%5Cnabla+V%5Ccdot+%5Cdot%7Bq%7D+%2B+%5Cdot%7Bp%7D%5E%5Ctext%7BT%7DM%5E%7B-1%7Dp+%3D+%5Cnabla+V%5Ccdot+%5Cdot%7Bq%7D+%2B+%5Cdot%7Bp%7D%5E%5Ctext%7BT%7D%5Cdot%7Bq%7D+%3D+%5B%5Cnabla+V+%2B+%5Cdot%7Bp%7D%5D%5Ccdot%5Cdot%7Bq%7D+%3D+0.+&bg=ffffff&fg=333333&s=0&c=20201002)
 -space will follow contours of the Hamiltonian. It’s also clear that the system is time-reversible, so flipping the sign of the momentum
 is a function of
  is a function of
 ![\displaystyle \tilde \pi(q,p) \propto \exp[-H(q,p)]](https://s0.wp.com/latex.php?latex=%5Cdisplaystyle+%5Ctilde+%5Cpi%28q%2Cp%29+%5Cpropto+%5Cexp%5B-H%28q%2Cp%29%5D+&bg=ffffff&fg=333333&s=0&c=20201002)
![\displaystyle \tilde \pi(q,p) \propto \exp[-V(q)]\exp[-T(p)],](https://s0.wp.com/latex.php?latex=%5Cdisplaystyle+%5Ctilde+%5Cpi%28q%2Cp%29+%5Cpropto+%5Cexp%5B-V%28q%29%5D%5Cexp%5B-T%28p%29%5D%2C+&bg=ffffff&fg=333333&s=0&c=20201002)
 will ensure that the
  . This is also the full-conditional for
  .
. can be done with

 updates to advance the time of the system by
  . The "optimal" value of
  or
or  are not unusual. There are various more-or-less standard methods for tuning these, but we will not consider them here.
 . We can improve the accuracy of this approximation by making the step size smaller, but this will come at the expense of a more slowly mixing MCMC chain.
![\displaystyle l(\beta;y) = y^\textsf{T}X\beta - \mathbf{1}^\textsf{T}\log(\mathbf{1}+\exp[X\beta])](https://s0.wp.com/latex.php?latex=%5Cdisplaystyle+l%28%5Cbeta%3By%29+%3D+y%5E%5Ctextsf%7BT%7DX%5Cbeta+-+%5Cmathbf%7B1%7D%5E%5Ctextsf%7BT%7D%5Clog%28%5Cmathbf%7B1%7D%2B%5Cexp%5BX%5Cbeta%5D%29+&bg=ffffff&fg=333333&s=0&c=20201002)
![\displaystyle l(\beta;y) = \sum_j\sum_j y_iX_{ij}\beta_j - \sum_i\log\left(1+\exp\left[\sum_jX_{ij}\beta_j\right]\right).](https://s0.wp.com/latex.php?latex=%5Cdisplaystyle+l%28%5Cbeta%3By%29+%3D+%5Csum_j%5Csum_j+y_iX_%7Bij%7D%5Cbeta_j+-+%5Csum_i%5Clog%5Cleft%281%2B%5Cexp%5Cleft%5B%5Csum_jX_%7Bij%7D%5Cbeta_j%5Cright%5D%5Cright%29.+&bg=ffffff&fg=333333&s=0&c=20201002)
 gives
gives![\displaystyle \frac{\partial l}{\partial \beta_k} = \sum_i y_iX_{ik} - \sum_i \frac{\exp\left[\sum_j X_{ij}\beta_j\right]X_{ik}}{1+\exp\left[\sum_j X_{ij}\beta_j\right]}.](https://s0.wp.com/latex.php?latex=%5Cdisplaystyle+%5Cfrac%7B%5Cpartial+l%7D%7B%5Cpartial+%5Cbeta_k%7D+%3D+%5Csum_i+y_iX_%7Bik%7D+-+%5Csum_i+%5Cfrac%7B%5Cexp%5Cleft%5B%5Csum_j+X_%7Bij%7D%5Cbeta_j%5Cright%5DX_%7Bik%7D%7D%7B1%2B%5Cexp%5Cleft%5B%5Csum_j+X_%7Bij%7D%5Cbeta_j%5Cright%5D%7D.+&bg=ffffff&fg=333333&s=0&c=20201002)
![\displaystyle \nabla l = X^\textsf{T}\left[ y - \frac{\mathbf{1}}{\mathbf{1}+\exp[-X\beta]} \right].](https://s0.wp.com/latex.php?latex=%5Cdisplaystyle+%5Cnabla+l+%3D+X%5E%5Ctextsf%7BT%7D%5Cleft%5B+y+-+%5Cfrac%7B%5Cmathbf%7B1%7D%7D%7B%5Cmathbf%7B1%7D%2B%5Cexp%5B-X%5Cbeta%5D%7D+%5Cright%5D.+&bg=ffffff&fg=333333&s=0&c=20201002)
 priors, it is easy to see that the gradient of the log prior is just
  . It is the sum of these two terms that gives the gradient of the log posterior.

 , the SDE
 on a common scale.


 . We assumed independent mean zero normal priors for the components of this vector, so the log prior is just the sum of logs of normal densities. Many scientific libraries will have built-in functions for returning the log-pdf of standard distributions, but if an explicit form is required, the log of the density of a
  at
at 
 , the likelihood associated with observation
  is
is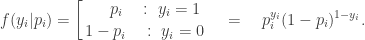
 we have

 is the linear predictor, so
  , giving
![\displaystyle \ell(\beta;y) = y^\textsf{T}X\beta - \mathbf{1}^\textsf{T}\log(\mathbf{1}+\exp[X\beta]).](https://s0.wp.com/latex.php?latex=%5Cdisplaystyle+%5Cell%28%5Cbeta%3By%29+%3D+y%5E%5Ctextsf%7BT%7DX%5Cbeta+-+%5Cmathbf%7B1%7D%5E%5Ctextsf%7BT%7D%5Clog%28%5Cmathbf%7B1%7D%2B%5Cexp%5BX%5Cbeta%5D%29.+&bg=ffffff&fg=333333&s=0&c=20201002)
 is 1 for success and -1 for failure. This isn’t really a problem, since the two encodings are related by
  . This new encoding is convenient in the context of a logit parameterisation since then

![\displaystyle \ell(\eta;\tilde y) = -\mathbf{1}\cdot \log(\mathbf{1}+\exp[-\tilde y\circ \eta]),](https://s0.wp.com/latex.php?latex=%5Cdisplaystyle+%5Cell%28%5Ceta%3B%5Ctilde+y%29+%3D+-%5Cmathbf%7B1%7D%5Ccdot+%5Clog%28%5Cmathbf%7B1%7D%2B%5Cexp%5B-%5Ctilde+y%5Ccirc+%5Ceta%5D%29%2C+&bg=ffffff&fg=333333&s=0&c=20201002)
 denotes the
 ![\displaystyle \ell(\beta;\tilde y) = -\mathbf{1}^\textsf{T} \log(\mathbf{1}+\exp[-\tilde y\circ X\beta]).](https://s0.wp.com/latex.php?latex=%5Cdisplaystyle+%5Cell%28%5Cbeta%3B%5Ctilde+y%29+%3D+-%5Cmathbf%7B1%7D%5E%5Ctextsf%7BT%7D+%5Clog%28%5Cmathbf%7B1%7D%2B%5Cexp%5B-%5Ctilde+y%5Ccirc+X%5Cbeta%5D%29.+&bg=ffffff&fg=333333&s=0&c=20201002)
![\displaystyle \ell(\beta; y) = -\mathbf{1}^\textsf{T} \log(\mathbf{1}+\exp[-(2y-\mathbf{1})\circ (X\beta)]),](https://s0.wp.com/latex.php?latex=%5Cdisplaystyle+%5Cell%28%5Cbeta%3B+y%29+%3D+-%5Cmathbf%7B1%7D%5E%5Ctextsf%7BT%7D+%5Clog%28%5Cmathbf%7B1%7D%2B%5Cexp%5B-%282y-%5Cmathbf%7B1%7D%29%5Ccirc+%28X%5Cbeta%29%5D%29%2C+&bg=ffffff&fg=333333&s=0&c=20201002)
 are 1 for a "success" and 0 for a "failure". The covariate
  all have 1 as the first element. The statistical model is
![\displaystyle \text{logit}\left(\text{Pr}[Y_i = 1]\right) = x_i \cdot \beta,\quad i=1,\ldots,n,](https://s0.wp.com/latex.php?latex=%5Cdisplaystyle+%5Ctext%7Blogit%7D%5Cleft%28%5Ctext%7BPr%7D%5BY_i+%3D+1%5D%5Cright%29+%3D+x_i+%5Ccdot+%5Cbeta%2C%5Cquad+i%3D1%2C%5Cldots%2Cn%2C+&bg=ffffff&fg=333333&s=0&c=20201002)
 , and
, and
![\displaystyle \text{Pr}[Y_i = 1] = \text{expit}(x_i \cdot \beta),\quad i=1,\ldots,n,](https://s0.wp.com/latex.php?latex=%5Cdisplaystyle+%5Ctext%7BPr%7D%5BY_i+%3D+1%5D+%3D+%5Ctext%7Bexpit%7D%28x_i+%5Ccdot+%5Cbeta%29%2C%5Cquad+i%3D1%2C%5Cldots%2Cn%2C+&bg=ffffff&fg=333333&s=0&c=20201002)
 observations and 7 predictors. Adding an intercept gives
  covariates. For the Bayesian analysis, we need a prior on